


A white paper on documentation quality for manufacturers shipping into regulated markets. It shows how to move from trusting that documents are correct to proving — with data — that quality is under control, reducing regulatory and liability risk.
Executive Summary
For manufacturers shipping into regulated, multi-market environments, technical documentation is not a production by-product — it is a compliance and liability surface. A missing regulatory statement, information that does not match the product, or a specification that does not apply in the target market can delay a launch, fail an audit, or expose a brand to legal risk long after the product ships.
Yet most documentation quality programs still rest on a trust-based assumption: that experienced people, working carefully, will catch what matters. That assumption does not scale, and it leaves no evidence behind. When something escapes, there is no data to explain why.
This paper sets out a practical alternative — treating documentation quality as a measurable, data-driven governance discipline. The core shift is simple to state and demanding to practice: move from “we believe it is correct” to “we can show it is in control.” The model is deliberately tool-agnostic; it can be run on a spreadsheet or a full quality platform, because what matters is the discipline, not the software.
It rests on six portable principles — make quality measurable, focus on the vital few, aggregate into signal, separate detection tracks, close the loop, and control at the source — and closes with a five-step path for organizations building this capability from the ground up.
1. Accuracy Is Not Enough: Documentation as a Risk Asset
Documentation quality is often judged as a matter of language — is the wording clear, consistent, and natural? Those qualities matter, but they are not where the costly failures live. In regulated manufacturing, the defects that actually stop shipments and trigger audits are usually compliance- and release-blocking issues that sit outside conventional editorial review:
- Missing or incorrect mandatory regulatory statements
- Incorrect country- or market-specific disclosures
- Wrong version, revision, or issue-date labeling
- Errors in identifying information — model name, part number, or barcode (causing customs delays or audit findings)
- Information that does not match the actual product (e.g., UI text, or procedural steps inconsistent with the real device)
- Specification-value errors (e.g., a wrong unit or a misplaced decimal)
These are not stylistic problems; they are governance problems. And they share an important property: many of these originate in the source content, before any translation or localization occurs. In source review across large-scale documentation programs, regulatory-requirement errors are frequently the single largest defect category.
The implication is decisive. Regulatory risk is not a variable that appears in translation; it is structural, and it must be controlled at the source. An error not caught in the source document propagates — unchanged or amplified — into every downstream language and format.
The most expensive documentation errors are rarely the ones readers notice. They are the ones auditors and regulators notice.
2. From Trust-Based to Evidence-Based: The Core Model
The difference between a team that “checks carefully” and one that governs quality is the presence of an evidence trail. An evidence-based program produces data every cycle: what was inspected, what defects were found, of what type, at what rate, and whether the trend is improving. That data is what turns quality from an opinion into a managed state. Six principles make the model portable to almost any manufacturer.
Principle 1 — Make quality measurable. You cannot manage what you do not score. Define a defect taxonomy (a finite list of error types) and define non-conformance as a threshold, not as the presence of any single error. This is subtle but important: if a document is judged non-conforming the moment one error appears, real process improvements never show up in the data — the rate stays pinned and the picture distorts. Borrowing from statistical process control, set tolerance limits appropriate to the nature of the document and its content; even within the same manual, regulatory and safety information should carry a tighter error budget than ordinary explanatory text. The goal is a score that moves when the process genuinely improves.
Principle 2 — Focus on the vital few. Most defects come from a small number of causes. The Pareto principle (roughly 80% of effects from 20% of causes) is the practical filter: each cycle, identify the top three most frequent error categories and treat them as priority improvement targets. These high-frequency categories are also, by definition, the most likely to escape internal review and reach the released document, the customer, or the field. Critically, not every error gets the same treatment — the vital few receive root-cause analysis and corrective action, while the remainder are monitored for trend and standard compliance. That differentiation is what keeps the effort sustainable.
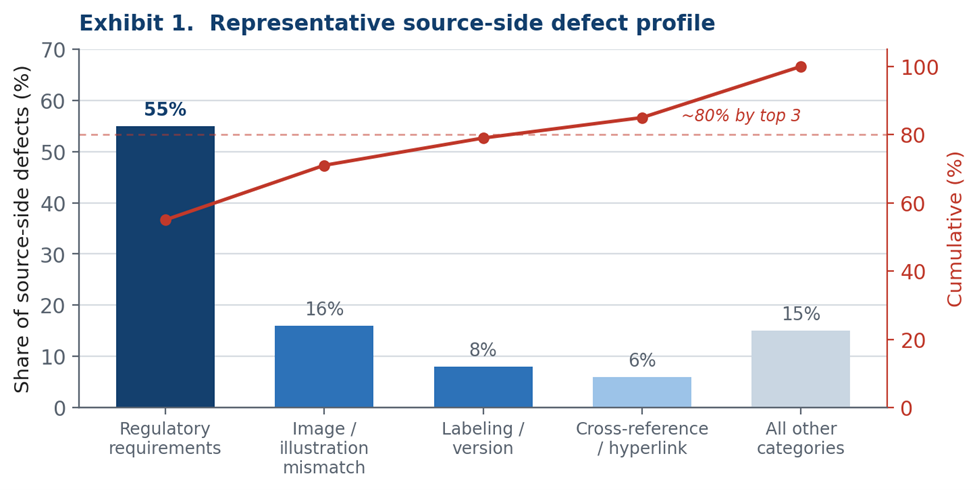
Principle 3 — Aggregate into signal. A single document’s inspection result is raw data, not information. Quality intelligence emerges only when results are aggregated. There is also a statistical reason to aggregate over a defined period: a sample becomes analytically meaningful at roughly 30 observations and reliable above 100. A monthly cadence is usually the smallest window that yields a valid sample in documentation work — frequent enough to act on, large enough to trust — and it is what lets you distinguish a one-time slip from a structural, recurring problem.
Principle 4 — Separate detection tracks, and treat leakage as a signal. Run quality on two tracks. Track 1 is internal: defects caught by your own QA before delivery. Track 2 is leakage: defects that escape internal filters and are found later — at customer review, engineering review, or in the field. The two carry very different meaning. Internal finds are the system working; leakage is the system failing, and it is your most valuable early-warning signal. Classify leaked defects by severity — for example, those requiring a formal corrective-action report versus minor issues — and treat the leakage rate itself as a headline metric.
Principle 5 — Close the loop. Fixing an error is not the same as preventing it. The objective is to ensure the same class of error cannot recur. When a defect — especially a leaked one — is found, trace why it passed the filters: at which stage it escaped, and why. Then implement a system-level countermeasure: an updated checklist, a tightened version-control rule, a corrected reference asset. This is the “self-healing” property of a mature program — a single human error results in a permanent improvement to the system, not just a corrected file.
Worked example. A recurring text-mismatch defect was traced to inconsistent source templates. Introducing a single standard template drove that category from roughly 17% of findings to near zero — and, once embedded in the checklist, it stayed there.
Principle 6 — Control at the source, then scale. Because the costliest errors originate upstream, the highest-leverage place to invest is source-content quality. Every defect prevented in the source is a defect prevented in all downstream versions at once. For manufacturers operating in many markets, the same discipline — taxonomy, thresholds, Pareto focus, leakage tracking, and corrective action — then extends to localized versions, holding each language to the same standard as the source. The model does not change with scale; only its breadth does.
How to define the core metrics
| Non-conformance | A document is “non-conforming” when its weighted defect score meets a defined threshold (a tolerance limit), not merely because one error exists. Thresholds are set per document type. |
|---|---|
| Non-conformance rate | Non-conforming documents (numerator) ÷ total documents inspected in the period (denominator). Tracked both monthly and as a year-to-date cumulative figure. |
| Target line | An operating KPI (for example, a low single-digit percentage) that the cumulative trend should stay below, even when individual months fluctuate. |
| Leakage rate | Defects found after internal QA — at customer or engineering review — as a share of activity. The primary early-warning signal of process weakness. |
One more thing. The artifacts this model produces — non-conformance trends, monthly reports, CAPA records, and version traceability — align, with no extra effort, with the objective evidence an ISO 9001 audit asks for. The work done to improve quality becomes the evidence that supports certification.
| Principle / step | Output (objective evidence) | ISO 9001:2015 clause |
|---|---|---|
| P6 — Control at the source | Source-stage regulatory-requirement review records | 8.2.3 Review of the requirements for products and services |
| Step 2 — Centralize reference assets | Version, revision & issue-date labeling; single current source and TM version tracking | 8.5.2 Identification and traceability |
| P1 — Make quality measurable | Threshold-based pass/fail decision (the release gate) | 8.6 Release of products and services |
| P4 — Treat leakage as a signal | Internal and leaked non-conformities identified and severity-classified | 8.7 Control of nonconforming outputs |
| P2 & P3 — Vital few & aggregation | Monthly aggregation, trend and Pareto analysis | 9.1.3 Analysis and evaluation |
| P5 — Close the loop | Root-cause / leakage analysis and CAPA records | 10.2 Nonconformity and corrective action |
3. What “In Control” Looks Like
A governed documentation program does not promise zero errors. It promises something more credible and more useful: a quality level that stays demonstrably within target even under stress.
The most revealing test is volume. Launch cycles create surges — a quiet month of a handful of documents can be followed by a month of hundreds. In a trust-based program, quality degrades silently under that load. In a governed one, the surge is visible in the data, and the cumulative non-conformance rate holds below target because the controls are systemic rather than heroic.
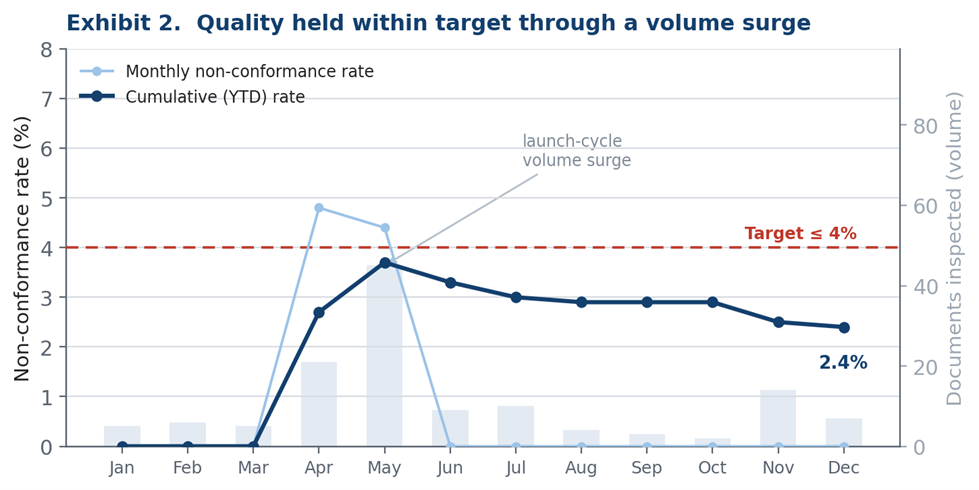
This is the practical payoff of the model: not the absence of errors, but the presence of control — and the evidence to prove it to an auditor, a customer, or a regulator.
4. Getting Started: A Five-Step Path
For an organization building this capability from the ground up, sequence matters more than sophistication. A spreadsheet-based version of the steps below delivers most of the value; tooling can come later.
- Write the standard down. Convert tacit “we usually check for…” knowledge into an explicit inspection checklist and a defect taxonomy. Ambiguous criteria are the first thing to fix — make every check unambiguous and shared, not stored on individual desktops.
- Centralize reference assets. Designate an owner for guidelines, regulatory references, and templates, and ensure everyone works from a single current version at a known location. A large share of “source” errors are really version errors.
- Score against thresholds. Define document-type-appropriate non-conformance thresholds so the metric reflects real quality, not noise. Begin recording every inspection result, even imperfectly — data started today compounds.
- Report monthly; focus on the top three. Aggregate into a monthly view, identify the vital-few categories, and assign root-cause analysis to those. Monitor the rest for trend.
- Make independence and the loop permanent. Where possible, separate the quality function from production so audits stay unbiased, and institutionalize corrective and preventive action so every significant defect ends in a systemic fix. One caution from experience: track process error rates, not individuals — individual scorecards damage morale and rarely improve the system.
5. Conclusion
Manufacturers competing across regulated, multi-market environments need more than accurate documentation. They need documentation they can prove is in control — to auditors, to customers, and to themselves. The shift from a trust-based to an evidence-based model is not primarily a technology investment; it is a discipline: measure what matters, focus on the vital few, aggregate into signal, separate detection from leakage, and close the loop so that errors teach the system.
Organizations that adopt this discipline lower the total cost of documentation — fewer post-release corrections, fewer compliance surprises, faster launches — while protecting the brand integrity that careless documentation quietly erodes.
FAQ
- Can quality be quantified in technical documentation such as manuals? Yes. The key is defining what to score: build a finite list of error types (a defect taxonomy) and define non-conformance as a weighted defect score reaching a set threshold, rather than the presence of any single error. This turns document quality from a subjective judgment into a measurable metric.
- What should be quantified? Quantify the defects that stop shipments and fail audits — missing regulatory statements, identifying information, specification values, and information that does not match the actual product — anything that can be judged against a defined criterion. The point is to score compliance- and release-critical defects, not readability or stylistic polish.
- How is improvement measured? Improvement is measured through the trend of the non-conformance rate aggregated over a period, usually monthly, rather than from any single document. A sample becomes analytically meaningful at roughly 30 observations and reliable above 100, so watching whether the monthly and cumulative trend stays below a target line shows whether the process is genuinely improving.
- Which items should be selected for improvement? Rather than treating every error equally, identify the top three most frequent error types each cycle and prioritize them. By the Pareto principle, a small number of causes produces most defects, and these high-frequency types are also the most likely to escape internal review and reach the released document, the customer, or the field. They receive root-cause analysis and corrective action, while the rest are monitored for trend.
- Does this kind of governance actually improve documentation quality? Yes — though the point is not that errors disappear entirely, but that quality becomes provably under control. Repeatedly applying root-cause analysis and corrective action to the top defect types improves the system so the same errors do not recur, and the cumulative non-conformance rate stays below target even when launch volume surges. Quality improves, and just as importantly, the improvement can be shown with data.
- Does documentation quality governance require special software? No. The model is deliberately tool-agnostic and can be run on a spreadsheet or a dedicated quality platform, because what matters is the discipline, not the software. Tooling can be added later without changing the method.